Data visualisation using Unity mesh generation.
Visualising complex datasets in a clear and engaging manner is crucial for making informed decisions. Our client required a way to upload their datasets to a content management system, and allow their customers to view the data represented as a 3D model in real-time. They also needed a way for key data sets to be represented on the mesh via vertex colouring.
We worked closely with our client’s data scientists to understand the importance of accurate and efficient display of their data as a mesh. Recognising this need, we explored the benefits of creating a data visualisation tool that combines the power of HDF5 files with Unity’s 3D capabilities.

How Does it Work?
Starting with the datasets the client produces and stores, the Hierarchical Data Format version 5 (HDF5) is a powerful and versatile file format designed for storing large amounts of data. It is particularly well-suited for scientific data storage due to its ability to efficiently manage complex data structures.
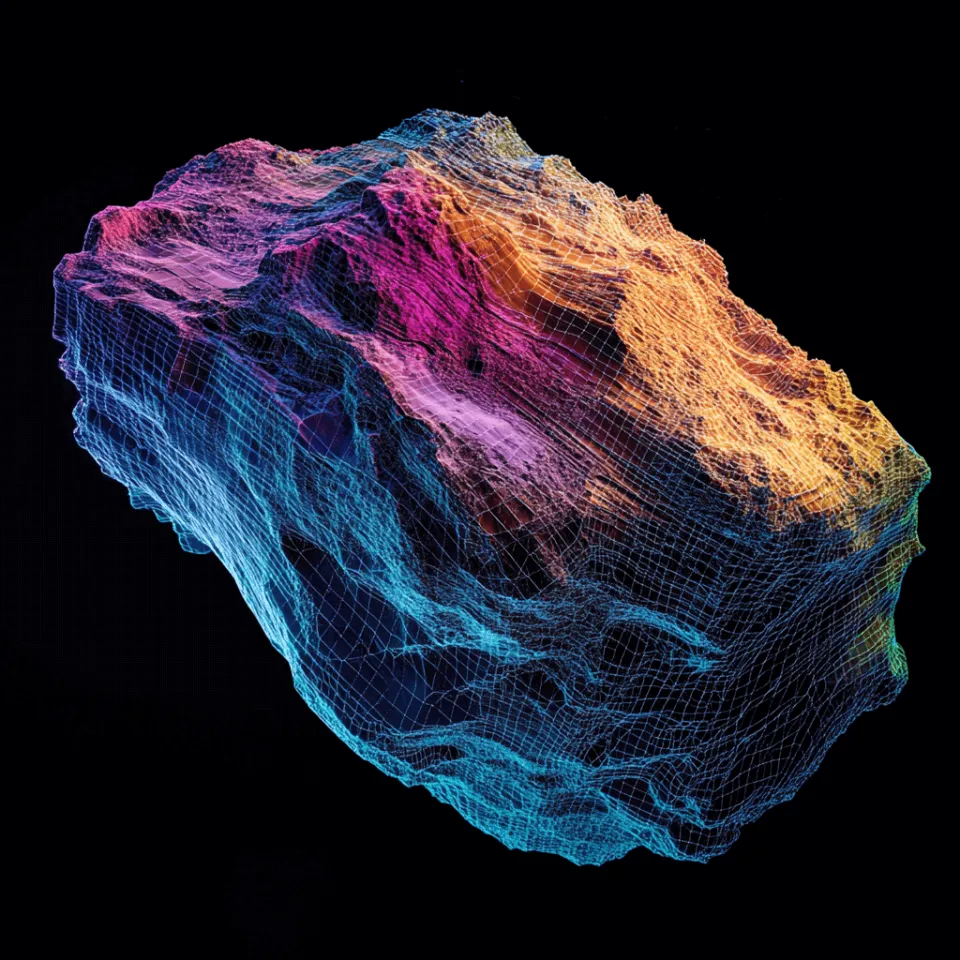
Unity, a leading game development platform, is renowned for its ability to create rich, interactive 3D environments. By leveraging Unity’s robust engine, we can transform raw data from HDF5 files into a visually engaging 3D mesh. This transformation is key to making the data not just accessible, but also understandable at a glance.
Utilising Python scripting and web API calls, we can extract the data from the HDF5 files and step through them to to generate a list of vectors, which are then translated into vertexes of a 3D mesh within Unity. These vertex points we generate can then also be assigned vertex colours to display critical information about the data, such as material properties, reflectivity, or luminosity.
The true power of this approach lies in its ability to represent complex data in an intuitive, visual format. Instead of poring over endless rows of numbers, users can now see the data represented as a 3D object, making patterns and trends immediately apparent.
with h5py.File(file_path, 'r') as hdf:
 # List all groups
 print("Keys: %s" % list(hdf.keys()))
 # Access a specific dataset within the HDF5 file
 dataset_name = 'pharma_data/sample_test_data'
 data = hdf[dataset_name][:]
 # Print the shape and data
 print("Dataset shape:", data.shape)
 print("Data:", data)
Outcome
With just a few clicks, our client can now upload their datasets for instant visualisation within Unity. Their customers can now view intricate details on the dataset represented on a 3D model in real-time. The tool speeds up their collection to review process by allowing instant visualisation, much improved from traditional methods of model and video generation for visual representations.

Other Applications
A visualisation tool such as this has broad applications across various industries. In fields like geoscience, environmental monitoring, and medical imaging, where data is often complex and multi-dimensional, and visualisation tools such as these offer a new way to explore and understand information. Researchers, analysts, and decision-makers can benefit from this tool’s ability to make data both accessible and actionable.
Frequently Asked Questions
Want to learn more? Get in touch